Blog: Reaching New Heights with Copilot for Microsoft 365 – Are You Ready?
In the ever-evolving landscape of digital transformation, Microsoft has consistently been at the forefront, driving innovation and enhancing productivity. The
Read articleFive times a year, Qlik releases new features and improvements for Qlik Sense. With every update, Qlik is listening to its users and making changes that help people to use the platform in an easier, more valuable and more seamless way. They want to enable data literacy within organisations so that even non-analysts can make the most of business data. For those already using Qlik Sense, they are filling in the gaps of functionality needed to fulfil a range of use cases, for example with sparklines which we’ll go into later.
Qlik Sense is already a fantastic analytics platform but with the June 2020 update it boasts even better functionality and even more impressive visualisations, plus it’s becoming even easier to use and more intuitive.
In this article I will explain my top four improvements and new visualisations from the Qlik Sense June 2020 update release. I’ll explain what the feature is, why it’s been added, and why I think it’s great. For some I’ll also give examples of potential use cases or real-life customer stories where we’ll be implementing these new features.
Previously there were two workarounds for sparklines. The first took time – to put in a visualisation object with custom characters and lots of “if” statements. Then if the trend is good, it’ll show an upward arrow, or if it’s negative, a downward arrow. The second costs money – buying a subscription to an extension company to have access to their visualisations. You’d integrate the extension object, but you’ve got to pay for the extension objects.
Now, it has been added natively. It’s a functionality gap from QlikView to Qlik Sense that they’ve now filled. You now get that visualisation included as standard..
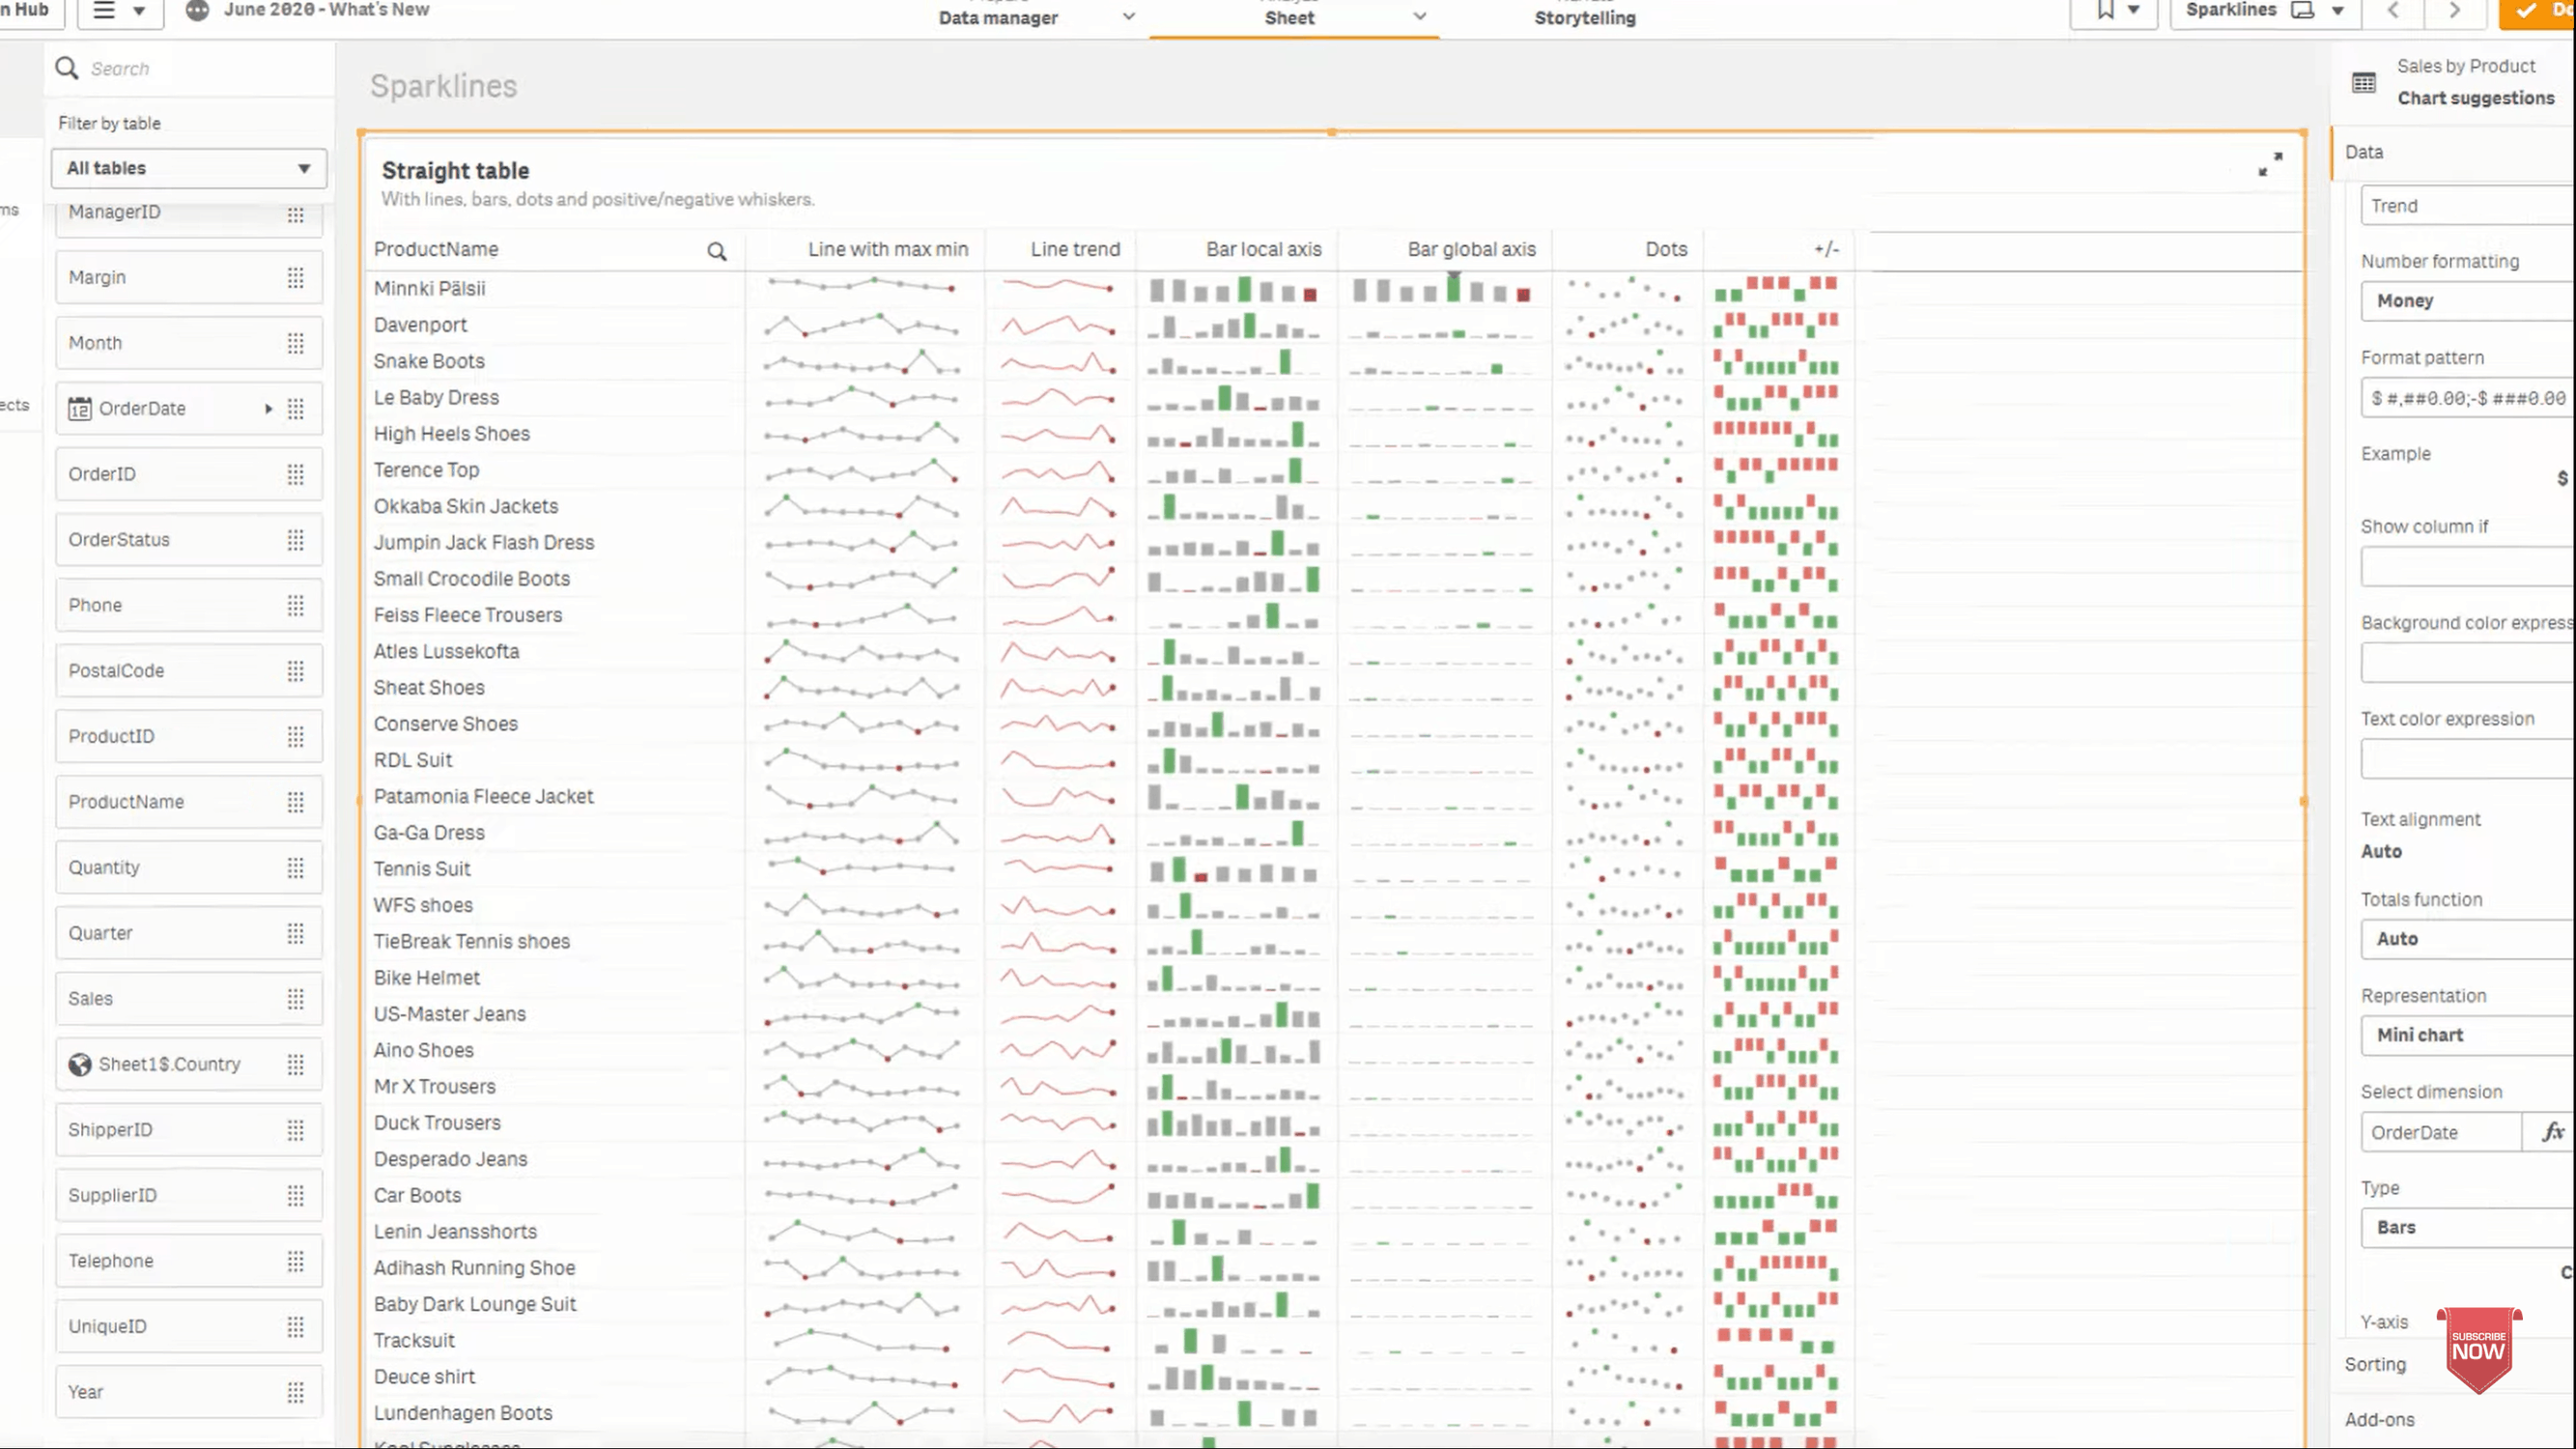
What are sparklines?
A sparkline visualisation means you have a headline statistic and the trend of it, all in one tabular view of information. It’s great for managers who want to monitor, but don’t have time to go in depth for things like KPIs. It’s not a major thing, but it’s quite a useful visualisation technique when you’re doing summary pages.
This is a neat, mobile-friendly way of showing you that little bit more information in one view. You can see trends at a glance.
Customer story
For a UK police force, we’re going to use sparklines. On the first page they want a summary page. They simply want to know whether the statistics are good or bad.
As the work started before this release, we had to do it in separate objects, and use a line chart next to a statistic. We’ve had to manually do the work to say, “if the sum of sales is greater than zero, then make the stat green, and add a tick,” and we’ve had to hard code in symbols. It doesn’t give you a breakdown of monthly trends.
And the problem with that is it’s not mobile friendly. When you put a lot of elements into a Qlik Sense dashboard, the mobile view is rendered from top to bottom, left to right. So you have to design them in a specific way, otherwise they appear out of order.
Now, we’ll be able to use sparklines.
For me, this is the most important improvement of this release. Say you have a chart about your sales. You have the dimensions (what you want to separate the chart out by – months) and your measure (your aggregation method – sum of sales).
The problem is, if you’ve got a sum of sales = 1 million pounds, the number of orders = 2 orders, and an average order value of £500,000, you’d have either multiple lines within your graph or multiple charts to display all of the info you wanted to get across. But those three lines aren’t going to work together on the same graph. You’d have one that’s up high, you’d have one that’s right down the bottom and then one in the middle.
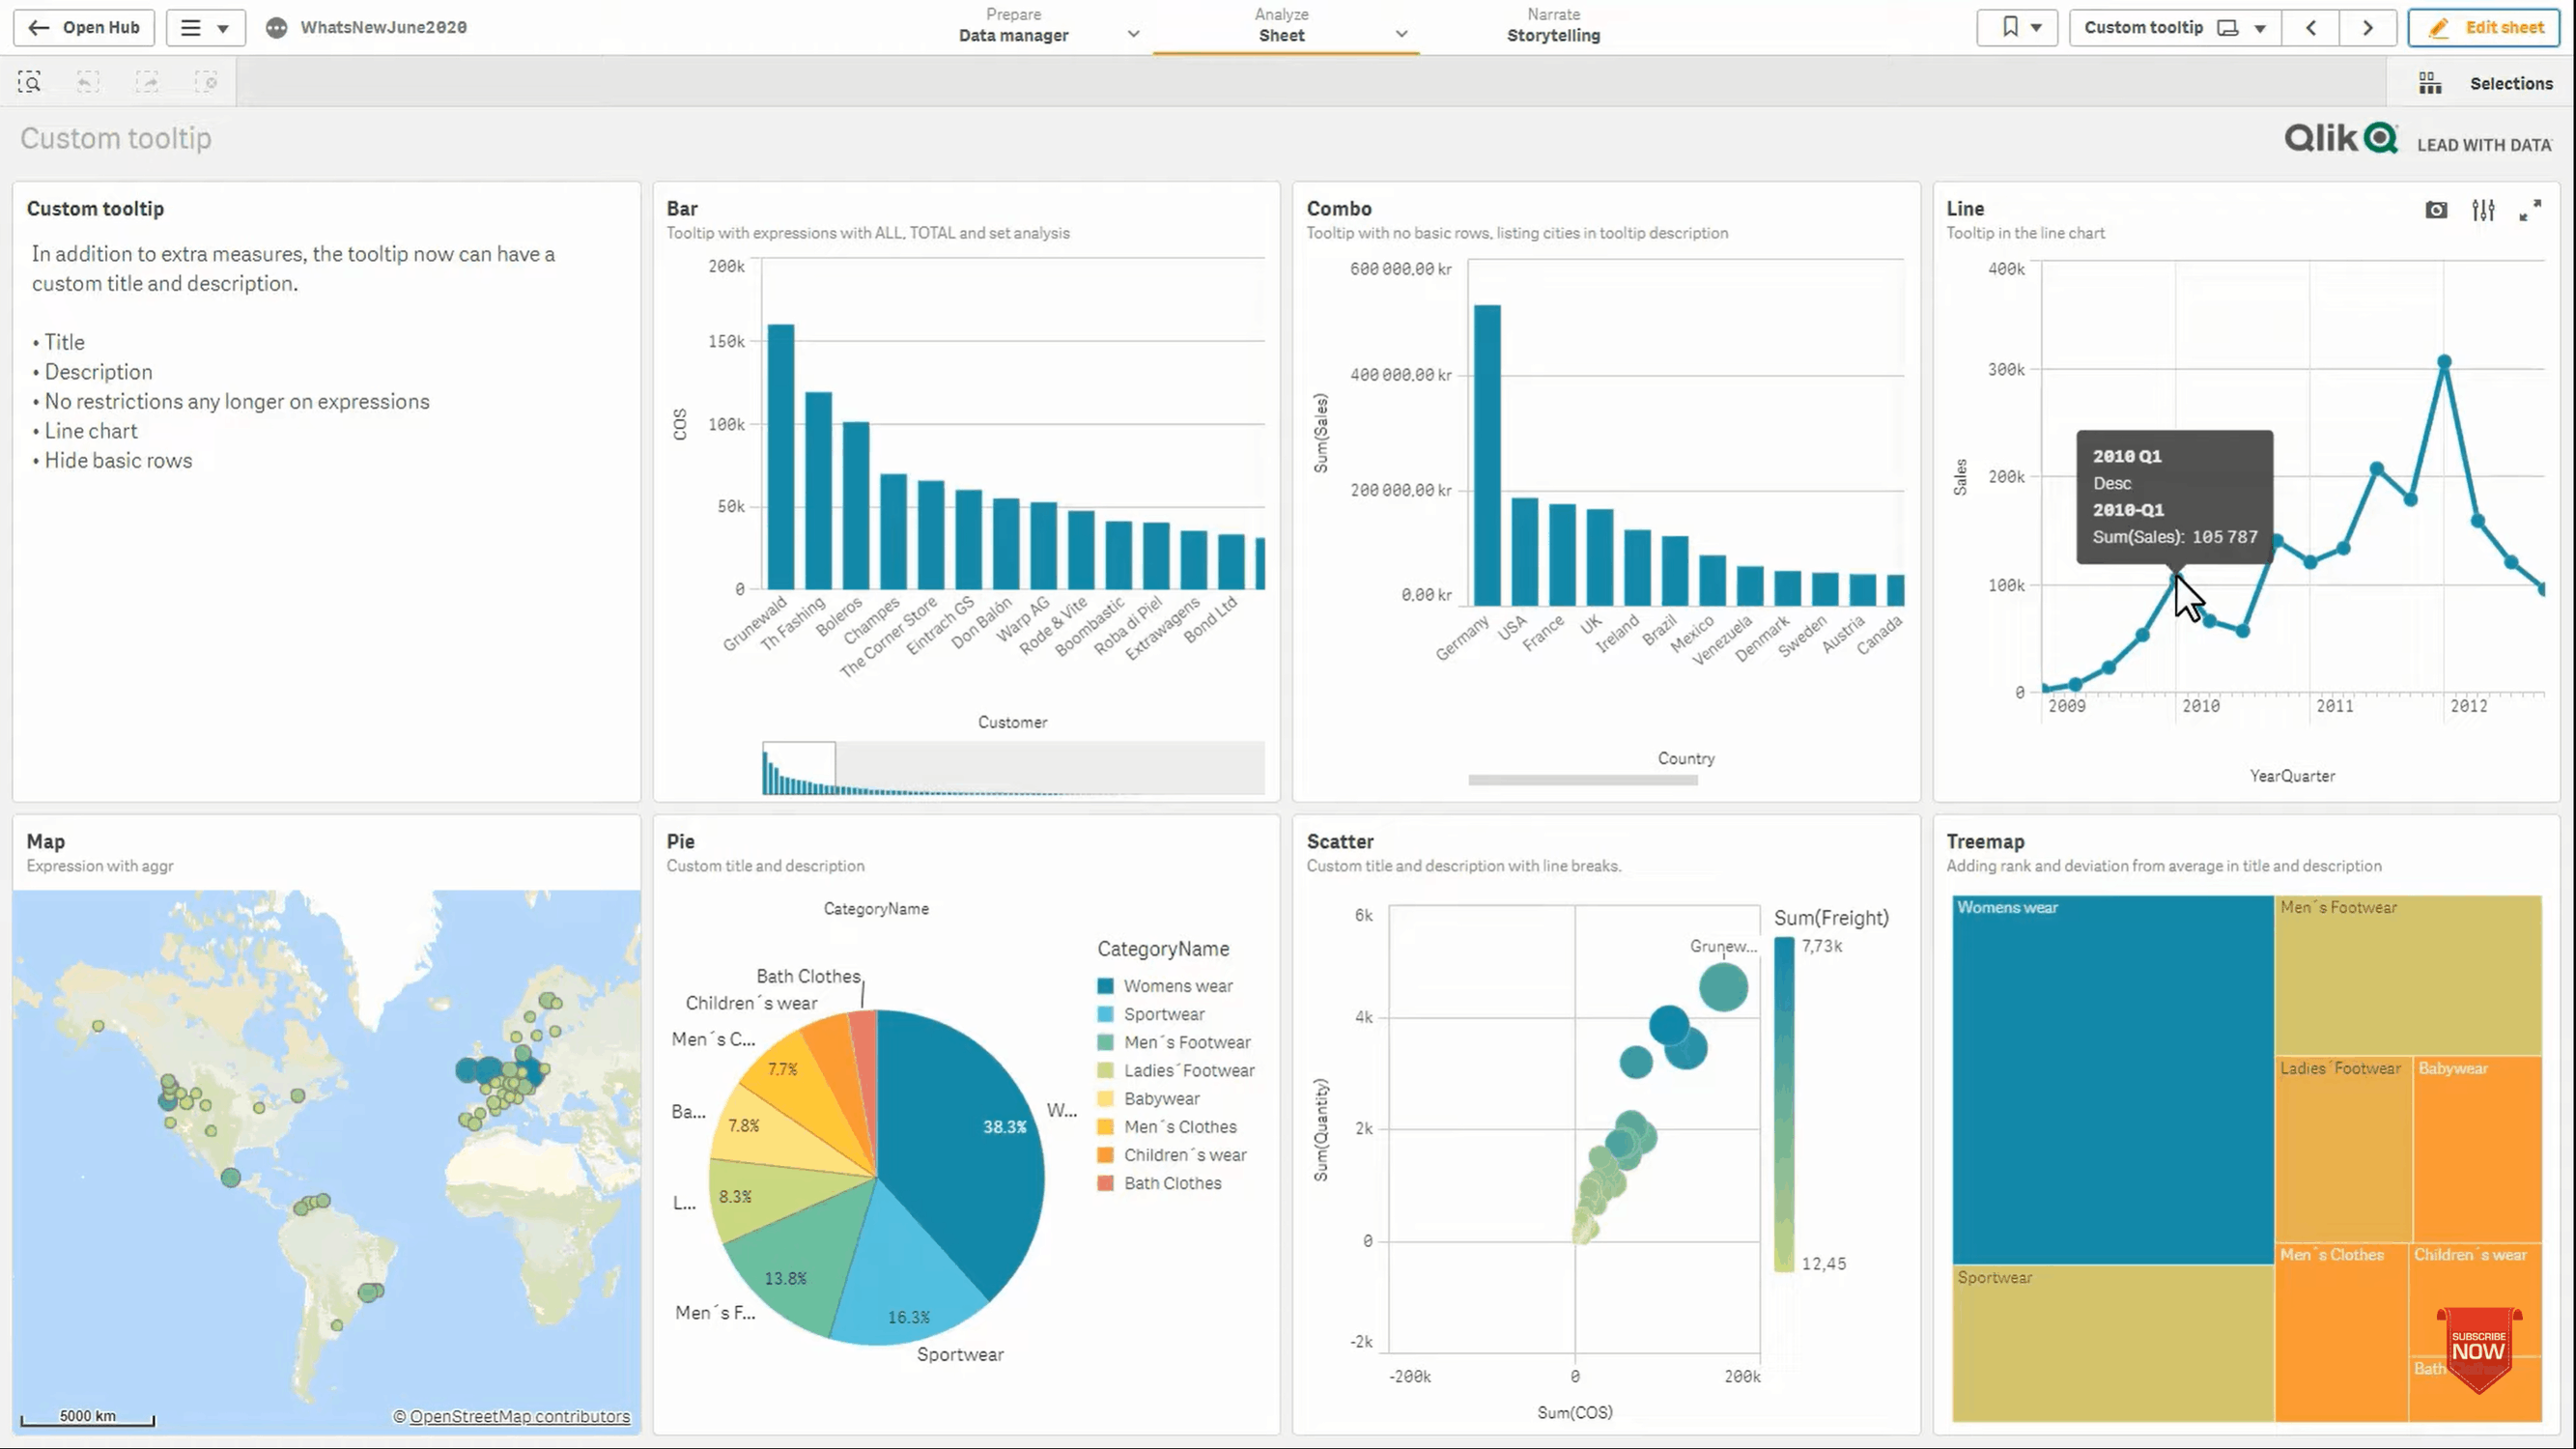
What are tooltips?
Tooltips are when you hover over a chart, a popup will appear with extra info. It enables you to take those lines out and have tooltips custom hovers.
Now, you can have just one “sum of sales” line and when you hover over it, it’ll give you the sum of sales, the number of orders, and the average value of the order. It’ll show you information about every data point as you hover over. You can add in whatever hover-over information that you want.
Tooltips mean you get a high level overview, or you can go in more depth if you want. It’s all about making it easier for the user because they can just hover over one point and see every piece of information without having to interrogate all these unneeded lines.
Qlik Sense Desktop used to be a free product, but it isn’t anymore. Now if you have a login for an enterprise or cloud environment, your administrator can allow you to use your login to authenticate a Qlik Sense Desktop installation. If you have a login for any of those environments, you can also use desktop. This still enables you to use the desktop functionality should you need it.
There have been a good number of UI and UX improvements released in Qlik Sense June 2020 to make the platform easier to use. You can now:
To summarise, the top 4 improvements for me are the following:
Learn more about Qlik Sense June 2020 from Qlik here.
We understand there are many options to choose from and you want to make sure the tool you adopt is the right one for you.
"*" indicates required fields
In the ever-evolving landscape of digital transformation, Microsoft has consistently been at the forefront, driving innovation and enhancing productivity. The
Read articleConstruction in Crisis! Written by Chrissie McAnelly, Cybit Data & Analytics Consultant – Construction Sector The construction sector is
Read article