Construction Industry Webinar: From Code to Compliance – Mastering the Building Safety Act 2022
Join us for our upcoming live webinar – “From Code to Compliance: Mastering the Building Safety Act 2022” 🗓️ Date:
Read articleWant to boost the effectiveness, value and security of sharing the valuable insights you find within Qlik? Qlik Analytics Platform (QAP) enables effortless manual or automatic sharing of reports and dashboards internally or with suppliers, partners and customers.
Using QAP, analytics can be quickly shared from web portals, extranets, or easily embedded into applications, portals and webpages – within a single data analytics platform.
Achieve a strong competitive advantage in your market sector. Improve value by providing your customers with analytics, right at the point of decision. Enable a far larger consumption of data and analytics.
Watch our on demand webinar where we’ll explore:
Embedded analytics seamlessly integrate analytic capabilities and content into your business applications, products, websites or portals. For example, this could be your CRM system, website, and SharePoint site.
It lets users quickly access relevant data and insights in their daily workflows without slowing down and switching to use a separate analytics application.
This makes it easier for organisations to empower employees, customers, suppliers and partners with the information they need to answer questions, make better decisions and take action faster.
The Qlik Analytics Platform is designed for application developers to easily embed and integrate Qlik’s powerful analytics capabilities right into their own applications, web pages and portals. These can be as simple as web mashups containing just a few charts or much more complex integrated web applications or on-device applications.
Users can access the data they need where they need it to be, in one place. They don’t have to slow down or switch to a different application. It empowers them to make better decisions and take action faster.
QAP is when we can use embedded analytics to turn insights into action. We can embed analytics into first-line business applications to help users action data even quicker.
Why Choose Qlik Analytics Platform?
The Qlik Difference:
QAP allows IT/developers to access the Qlik Associative Engine and library of visualisations to build data analytics solutions into their existing workflow of internal apps. The Qlik Associative Engine ensures that analytics are fully interactive and stay in context together.
The Qlik Associative Engine is the world’s best associative data indexing engine, which ingests data from any source and provides rapid access to all of it, performing calculations and aggregations on the fly. The Qlik Associative Engine ensures that analytics are fully interactive and stay in context together.
Use cases
We could embed analytics into portals for customers, suppliers, partners. You can increase value and offerings to external people.
Embed into applications whether CRM (Dynamics 365 or Salesforce), SharePoint, intranets, wherever the analytics needs to be.
When you ask questions and make selections within your dashboards, and the data automatically flexes.
We can embed onto a portal and the data is interactive, the data will flex for you.
Maybe we don’t want it all to be public, maybe some of it is sensitive or not relevant to everyone. We could add a login and allow people to login and see only the data relevant to them.
Let’s look at an example customer portal. Now I get data that is just relevant to me. We can brand these portals too.
The important thing here is we’re using a centralised, governed, secure application from the data. It’s very time efficient because I don’t have to build a report for every customer, they can interact with the data themselves.
You could also have a supplier portal. They’re given the same data but it’s only showing data relevant to the supplier like how their products are doing.
We can have another portal for marketing data. We can have a menu. There are a lot of insights here. We can ask questions, filter down data. We can jump to different pages with a range of different visualisations on there.
To get data into portals we can use APIs. You select the Qlik Sense dashboard you’re interested in, for example, a Sales app. Qlik then lists all the visualisations and items we have within the dashboard, for example ‘Margin Amount Over Time’ – a line chart. We can apply themes, we can disable interactions or animations. We can customise how these visualisations work when we embed it into our application.
We have an object URL, and if we copy and paste that into Google Chrome we can view that visualisation online. This is how easy it can be to start surfacing our analytics.
Calderdale Council were using QlikView and we helped them to implement Qlik Sense and QAP to share analytics on the web for residents without the need for them to have a licence to view data. They needed it to be easy enough for any resident to access and understand.
It’s led to better transparency, it promotes collaboration, and it pinpoints areas requiring improvements. Residents can easily view and interrogate the data on their online portal.
This has managed to help upturn the downward trend of adults placed permanently placed into care homes.
The Qlik Analytics Platform is designed to allow application and developers to easily and flexibly embed powerful Qlik visual analytics capabilities right into their own applications. These can be as simple as web mashups containing just a few charts or much more complex integrated web or device applications.
There are some fantastic opportunities you can increase the adoption of analytics and increase the value you provide to your staff, customers, partners, vendors, and suppliers.
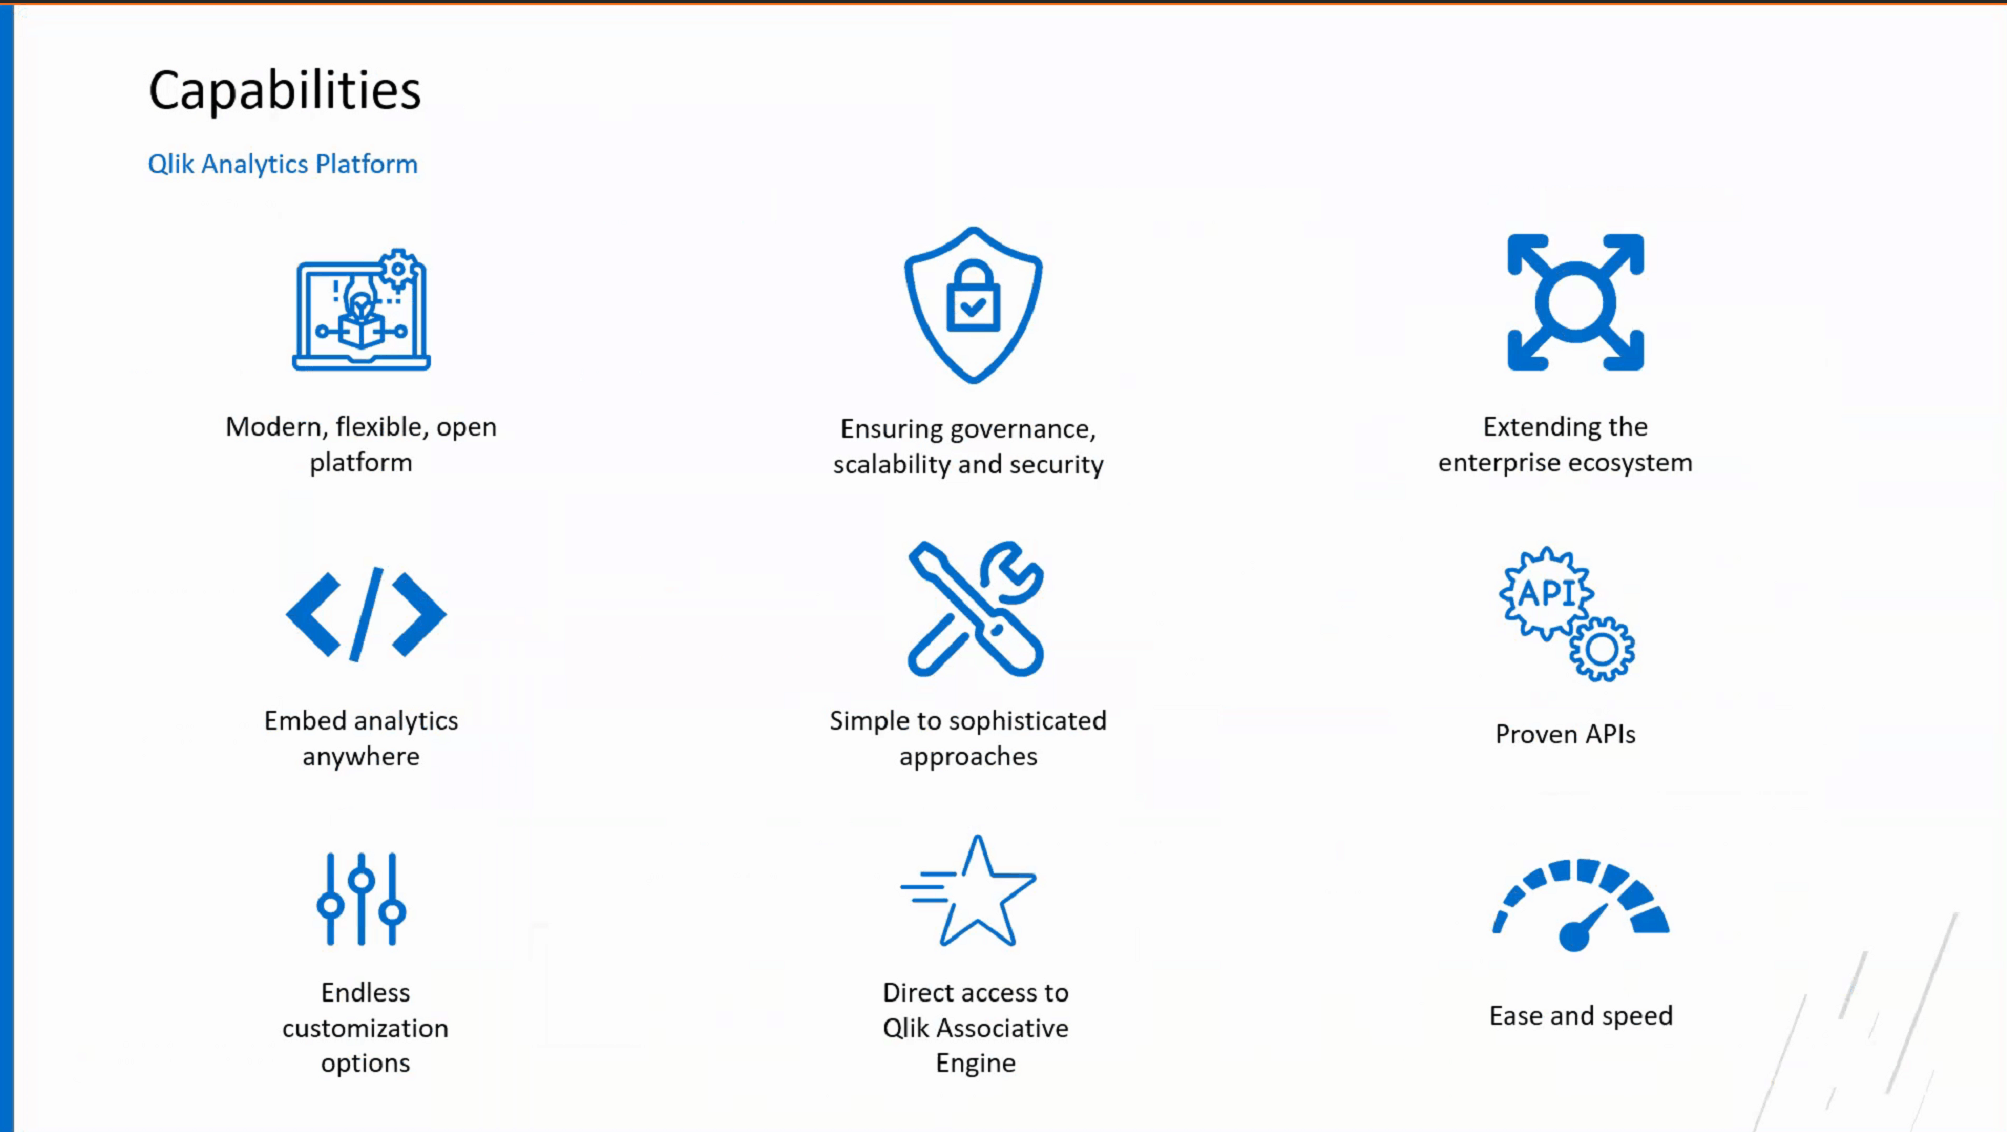
Platform for the Enterprise – Modern, flexible, open data analytics platform to ensure governance, scalability and security while extending the enterprise business eco-system.
Customise and embed with ease – Embed analytics with QAP across the enterprise, workflow, webpages, business apps and portals. Embed simply or to more sophisticated levels (APIs). Leverage a rich library of proven server and client–side APIs.
Deliver analytics for application developers – Extend Qlik into other applications using APIs and mashups, etc. Give customers and OEM partners direct access to the Qlik Associative Engine. Develop quickly and more rapidly with developer hub, APIs, templates, etc.
We’re Qlik’s UK & Ireland #1 partner for two years running.
The first port of call would be a free analytics consultation to learn more about any of the Qlik products, would they be a good fit and what benefits would they provide.
We also offer a consultancy bundle for QAP to get you up and running with the platform, where we can discuss the licensing and next steps.
Can you use QAP with QlikView?
It uses the same platform as Qlik Sense but it could be used with QlikView. You can retain QlikView for your internal guided analytics experience.
What’s the difference between QAP and NPrinting?
That is more static reports or HTML reports. It’s a static report. It will be a flat image, you lose the power of the Associative Engine. As soon as a customer or supplier get a report they may have a question the visualisation can’t answer. QAP can help them to answer their own answers, interrogate the data, and drive more insight.
We understand there are many options to choose from and you want to make sure the tool you adopt is the right one for you.
"*" indicates required fields
Construction in Crisis! Written by Chrissie McAnelly, Cybit Data & Analytics Consultant – Construction Sector The construction sector is
Read articleBy Asiel Esgair – Cybit Data & Analytics Consultant – Public Sector & Local Authority In our
Read article